

It has been a while since I last wrote and since that time more than 400,000 additional deaths have been reported due to Covid-19. The Center for Disease Control (CDC) ensemble forest model predicts that roughly 17,000 to 29,000 new deaths will likely be reported in the week ending February 13, 2021 and the total number of deaths will be around 465,000 to 508,000 by that time.
Let’s delve into CDC’s ensemble forest model but before that it’s helpful to understand what is exactly is an ensemble model. Ensemble models are essentially ‘Model of Models’ and combine projections from multiple models into one projection. Ensemble models are relatively recent and have been becoming more popular as it has been shown that predictions from a collection of models are better than an any individual model as the ensemble model smoothens the bias and variations from individual models. Rather than relying on a single model the ensemble model combines multiple models and in that way reduces variance by voting/averaging modelling errors of multiple models; by combining predictions from several models the ensemble models tend to be more flexible (less bias) and less data-sensitive (less variance). In particular, ensemble models have been proven to be better at predicting seasonal flu outbreaks and so it was natural that they would be used for the Covid-19 pandemic forecasts. There are lot of good resources to learn about ensemble models but in brief the two mainstream ways of building an ensemble model are Bagging and Boosting and the different approaches are shown below visually.
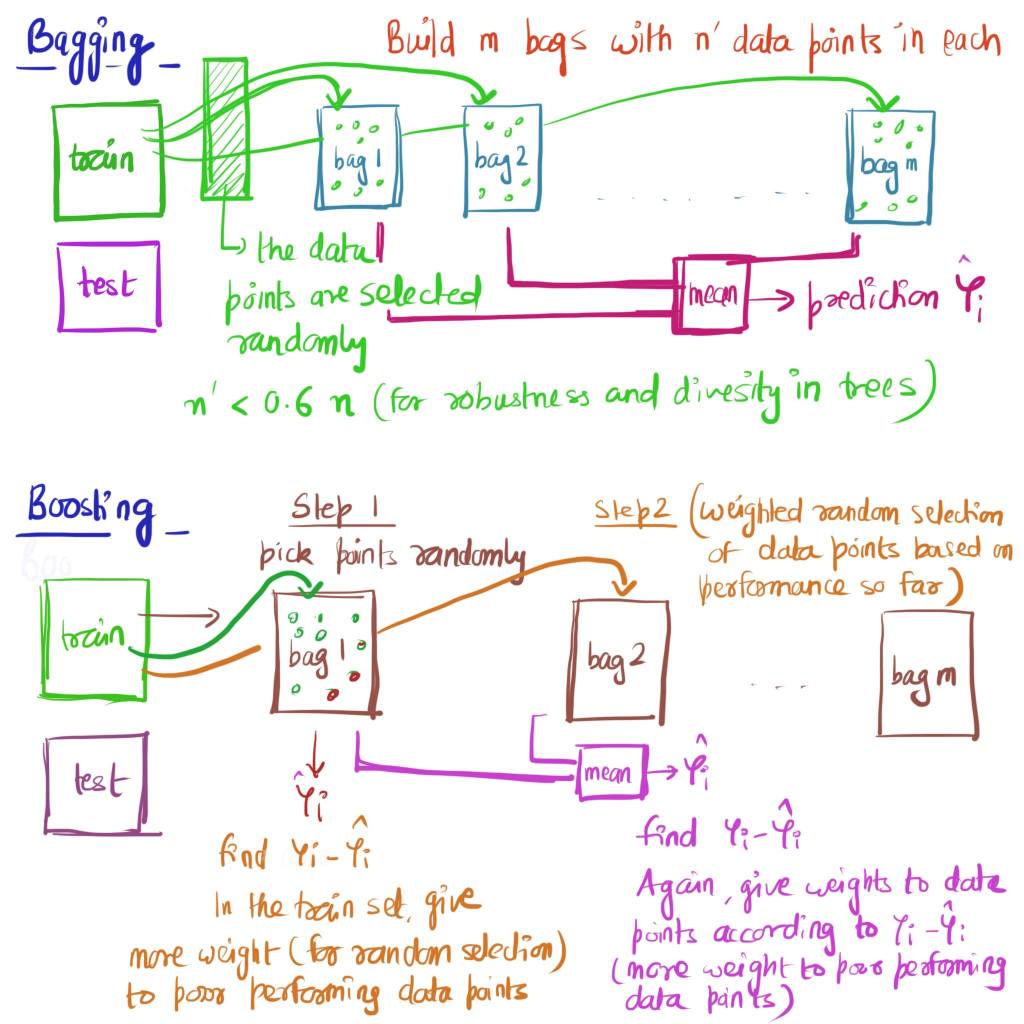
Bagging creates many datasets (‘m’ bags above) and builds a model (e.g. decision tree) for each dataset and then combines all of the models (e.g. decision trees) to create a final outcome. Random forest is an example of an ensemble model which uses Bagging as the ensemble method and a Decision Tree as the individual model with a feature that at each split of decision tree rather than using the entire set of inputs, only a random subset of inputs is used. On the other hand as shown, Boosting builds a single model from the entire training dataset at any iteration but builds successive models (bag 2 to bag m above) which learn from the errors of the previous version of the model. Two popular methods in Boosting are AdaBoosting where learning is done by increasing the weights of misclassified data points and Stochastic Gradient Boosting where learning is done by using inputs from the residual errors directly. For better illustration of these two methods and Python code for Bagging and Boosting refer to this Medium post.
Now coming back to ensemble forest model used by CDC which is maintained by the Covid19 Forecast Hub and is a collaborative effort by CDC, academic groups, private industry groups and government affiliations. This ensemble model from ‘Covid-19 Forecast Hub’ published by CDC, combines each of the independently developed Covid-19 forecasts into one aggregate forecast over the next 4 weeks. CDC’s ensemble model aggregates these individual models by taking the median prediction across all ‘eligible’ models at each quantile level (10% to 95% prediction interval) of the predictive distribution. As outlined in their website to be considered ‘eligible’ for inclusion in the CDC ensemble model, certain requirements have to be met; (i) forecasts have to be submitted a week prior to be included in that week’s ensemble (ii) submissions needed to contain forecasts of deaths for at least 50 states and the predictive distributions needed to be represented from 10% to 99% confidence intervals (iii) the model have to assign at most a 10% chance that cumulative deaths would decrease in their one-week ahead forecasts (iii) at each quantile level of the predictive distribution the quantile projection should be constant or increasing over time. The last 2 requirements are laid out to make sure that cumulative deaths over time are not decreasing. Currently, 37 models are combined into the ensemble model and these individual models use a number of varying assumptions about the level of social distancing in the 50 states and how they will change over the next 4 weeks. As mentioned before, the advantage of the ensemble model lies in combining all of these 37 individual modelling assumptions (and related errors) to create one aggerate forecast which ends up being not being overtly sensitive to one particular model’s assumptions and more accurate than any individual model.
The ‘ensemble forest’ modelling approach for Covid-19 forecasting is of course far from ‘perfect’ and there are lot of improvements that can be made. The Covid-19 Forecast Hub published a paper in August 2020, comparing performance of their ensemble forest model and the Mean Absolute Error (MAE) of their model i.e. difference of forecasted and observed value of deaths due to Covid19 was 760 deaths for 1 week horizon and 2423 deaths for 4 week horizon for the period March to July last year; a very sobering and wide range of forecast given that we are speaking of human lives. Future avenues for improvement as noted in their paper include not weighing each individual model equally but weighing each model based on historical performance of that model while making sure that the weighing is dynamic and flexible. More to come in this corner and so keep track of the Covid-19 Forecast Hub.
