
Junk Bonds
Second quarter 2020 had a massive amount of debt issuance across High Yield (HY) and Investment Grade (IG) ratings and the month of June 2020 now has the dubious record of being the most active month for junk bond issuance. Dealogic reported that U.S. issuance of junk bond for June stood at $51.5 billion which is much higher than the previous record of $40.8 billion in September 2012. Year to date issuance of junk bond is at $199 billion and yields are touching lows of 5.41%. Why is there a massive boom in debt issuance and a huge investor appetite when concerns over the economic recovery persist, unemployment is in double digits and chapter 11 bankruptcies have risen by 26% in June compared to last year?
This year’s massive junk bond sale was triggered by the Fed’s March 23 announcement when it announced that it would directly buy corporate debt a week after announcing lowering of interest rates to zero. Since then, the Fed has bought about $12 billion of corporate bonds and exchange-traded funds till the end of July and $1.1 billion of junk bonds. (unlike investment grade debt, the Fed buys junk-rated debt only through exchange traded funds, ETFs). The Fed’s announcement had the immediate effect of lowering the yields of junk bonds as shown below; yields peaked in mid-March at over 11% as the economy shut down due to the pandemic but immediately dropped following the Fed announcement and currently are at 5.41% the same level as last December.

Interestingly, the WSJ reported this week that private equity companies have benefited the most from the current boom in junk bond issuance since more than half of the junk bond issuance ($31 billion of the $51.5 billion) was done by private-equity-backed companies and for private equity sector this debt issuance is the highest since 2014.
Leveraged Loans
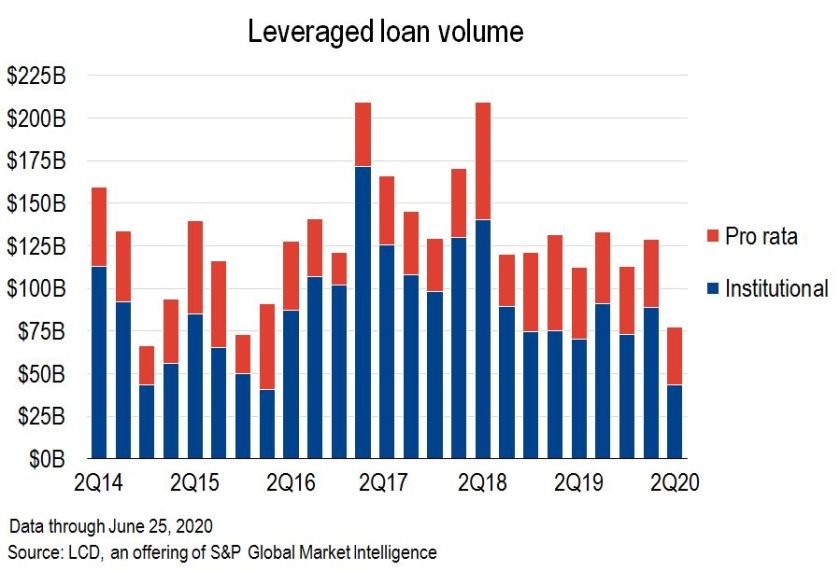
In contrast to junk bonds, leveraged loan issuance has ground to a halt and the U.S. institutional loan activity is at a four-year low of $44.4 billion (compared to almost $199 billion in junk bond issuance) as shown below. S&P reports that demand for leveraged loans has dried up since March and that the second quarter issuance is down 38% from last year (while junk bond issuance is up by 65% compared to last year).
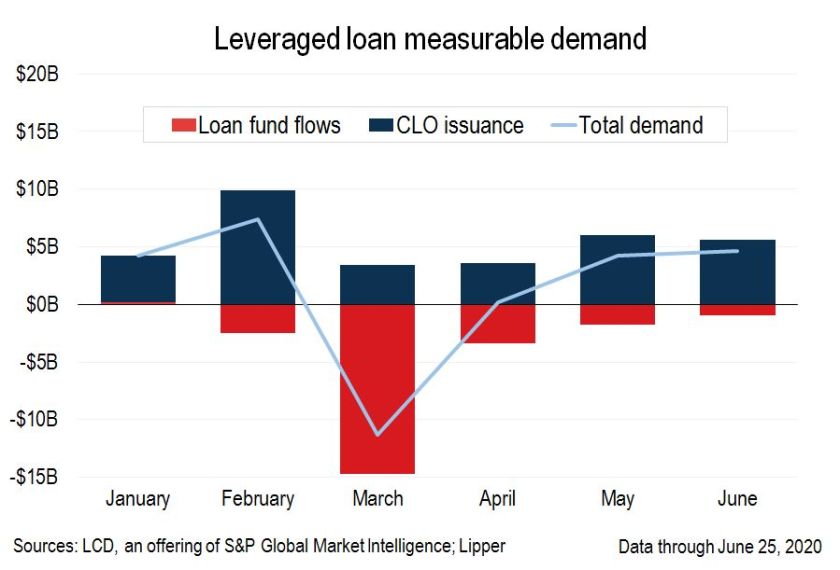
The contrast between junk bond issuance and leverage loan issuance is reflected in the flow of retail money into funds; loan funds have seen net outflows since pandemic while in contrast bond funds have seen net inflows. As the graph below highlights besides funds, CLO (Collateralized Loan Obligations) issuance are the single biggest indicator of leverage loan demand (CLO’s are built from leveraged loans and buy almost half of all the leveraged loans) and CLO’s have taken a hit since the pandemic.
CLO’s
The demand for CLO’s in turn has reduced because of concerns of an increase in anticipated defaults due to the lockdown. A recent UBS report quoted in a Bloomberg article predicted that the market for collateralized loan obligations is currently pricing just a fraction of the likely wave of defaults caused by the coronavirus and the 1 year default rates could range from 9 to 14% as shown in figure below (based on decline in revenues of 20 to 30%). Along the same lines, Moody’s said in April when the pandemic started that it could cut the ratings of a fifth of all bonds issued by CLO’s. In both of these projections, an underlying concern is that most of the leveraged loans issued which have been packaged into CLO’s are covenant lite loans which are weaker in credit protection for investors.

Another reason for the divergent behavior between junk bonds and leveraged loans is that the Fed is only buying AAA bonds or the most senior and secure tranches of CLO’s. So who are the investors and holders of CLO’s right now? Interestingly, insurers have now become the biggest U.S. investors in the market, topping banks and hedge funds to amass a third of all domestic holdings according to data compiled by the Federal Reserve and recently reported. Insurance companies and mutual funds according to the report hold 50% of the CLO market. While banks also hold CLO tranches, almost 95% of their holdings are senior tranches while insurance companies have mezzanine and equity tranches making up 50% of their holdings. In a sign of things to come, Janus Henderson recently filed with SEC to build a U.S. ETF that will seek floating-rate exposure to the highest-quality CLOs which means that day traders can now buy CLO’s with the creation of this ETF for CLO’s. This does not look like it will end well for the day traders…….
