
US Jobless claims and monthly unemployment data
There is an expectation that the worst of the economic effects of the pandemic are behind us and that the recovery is on the rebound and the job numbers that came out this week reflected that. Initial jobless claims in US fell by 249,000 to 1.19 million in the week ended Aug. 1 as shown below; this was the largest improvement in almost two months.
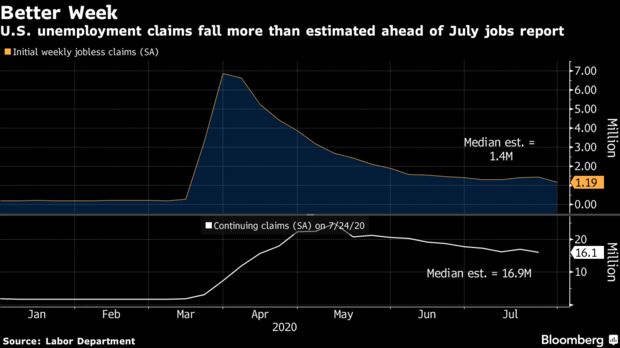
Continuing claims i.e number of Americans claiming ongoing unemployment benefits in those programs showed the same trend and decreased to 16.1 million in the week ended July 25, the lowest since April as shown in figure below.

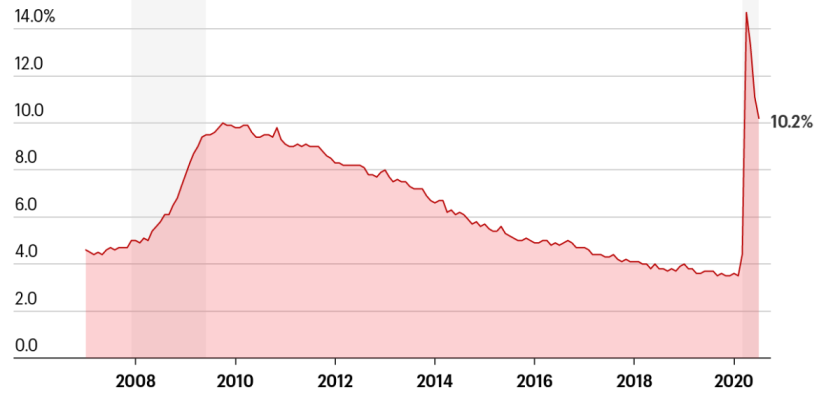
The drop in the initial claims and the ongoing claims was also reflected in the monthly employment data that came out this Friday which showed that hiring increased in July for 3rd straight month with 1.8 million jobs being added and the unemployment ratio dropping to 10.2%.
The drop in unemployment in July was driven by the resumption of economic activity in areas that had been shut down due to Coronavirus in April and May and the most notable job gains occurred in leisure and hospitality, retail and health care as reported in the Bureau of Labor Statistics (BLS) report. Leisure and hospitality caused almost one-third of the gain in total non-farm employment followed by food services as restaurants and bars started to open. Despite the gains over the last 3 months, employment in food services and drinking places is down by 2.6 million since February and this sector remains at risk based on recent spikes in coronavirus cases which are forcing some states to pause or roll back their reopening plans.
Despite the 5% drop in unemployment since April 2020, there are still nearly 13 million lesser jobs than in the February according the BLS report and what is not being realized in the optimism of the stock market is that the recovery is going to be painfully long. As a supporting point, the CBO (Congressional Budget Office) estimates that unemployment in US will remain above 10% for remainder of 2020 and well into 2021.
Lastly, the July BLS report had some worrying numbers behind the positive headline that need to be watched in coming monthly reports that are highlighted below.
- % Long term unemployed – The number of people who have been out of work for more than 15 weeks is now at the highest level since 1948 and rose from 4.6 million to 6.5 million showing that majority of the workforce that got unemployed in March is still unemployed. This unemployment bucket could signal permanent job losses since the longer someone remains unemployed the harder it becomes for them to get back into the workforce and this shows up in the labor force participation rate.
- Labor Force Participation – the labor force participation rate did not budge in JUly and stayed flat at 61.4% from 61.5% in June which shows that the recovery is at a nascent early stage.

- Average weekly hours – another troubling sign is that the average weekly hours decreased from slightly from prior month from 34.6 to 34.5 hours and whether this is a blip or trend needs to be watched.

Other more interesting figures behind the positive headline is available at the US BLS website. This positive headline of the drop in unemployment is of course coming against the backdrop of an additional round of economic aid package that is being considered. However the above figures show that economic rebound still has to build momentum and with the resurgence of coronavirus in some states could also slip back.

2 comments